Analysis of a Stellar Cluster
06-02-2023An article explaining how the age of a stellar cluster could be determined given various data. Using data provided by studying 3106 stars in a cluster, the age of the stellar cluster could be approximated using an HR diagram. In order to compare the data to an HR diagram, I had to create an HR diagram and adjust the scales and values to compare it with an HR diagram with known main sequence lifetimes. I was able to conclude that the stellar cluster was approximately 1010 years old using the turn-off point.
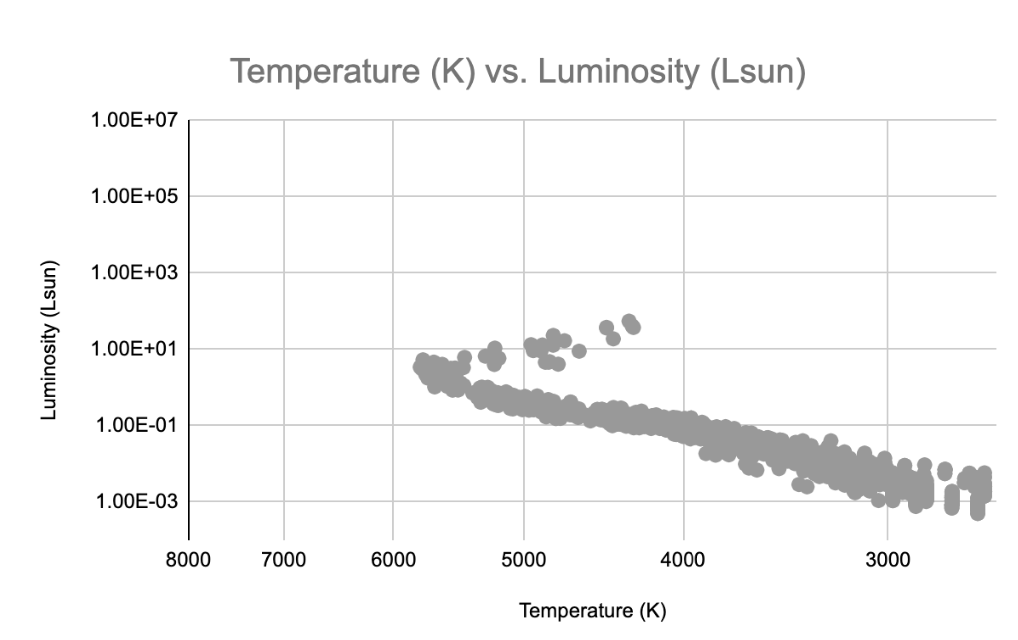
A normal scale HR diagram which plots the stellar clusters as temperature and luminosity. This plot uses log scales on both axes to show the distribution of stars and is useful in determining the relative size and type of many stars on the main sequence.
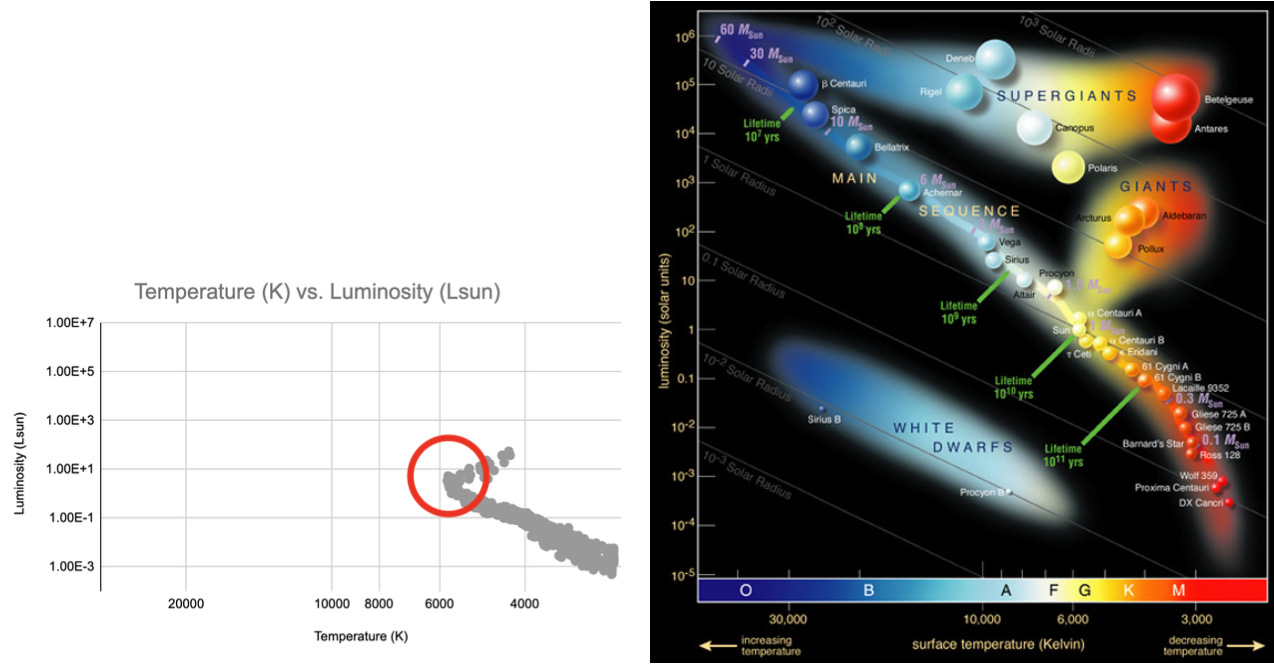
A side-by-side comparison of an upscaled version of Figure 1. which is more similar to the known HR diagram. Since the diagrams use a similar scale, they can be directly compared to place the turnoff point, represented by a red circle, onto the HR diagram on the right to determine the age of the cluster. The image on the right was taken from The Cosmic Perspective by Bennett, et al.